
Search and SEO are evolving rapidly in the wake of new AI options. Many of our clients are concerned about continuing to receive a return on their SEO investment. They worry about putting effort into the right places. And they worry about how to prepare for a drastic shift in the landscape, should it come.
The speed of evolution has made these questions difficult to answer with authority. But we conducted research, asked some experts, and have some theories that put these fears into context. Hopefully, they can help your organization navigate these uncharted waters.
Do AI Overviews reduce click-through rates?
In 2024, Google introduced AI-generated answers to queries in its search results. These “AI Overviews” are more likely to appear when a visitor phrases their search query like a question, using “what,” “how,” or “why” language. These overviews provide citations to their sources and a right sidebar (on laptops) with other references. Some are calling the traffic these overviews generate “zero-click” searches.

While the answer is yes, click-through rates have reduced by as much as 10%, others argue that most websites will be unaffected. For one, Google has scaled back their AI Overviews to only 1.28% of its billions of daily searches. This will likely increase now that AI has become less likely to provide incorrect answers, but the misconception that AI Overviews are everywhere is overblown.
Further, the same article goes on to assert that 96.5% of all AI Overviews appear for informational keywords — meaning very few overviews are created for transactional, navigational, and local searches. Informational questions are much easier and safer for AI to answer and will likely remain the dominant use case.
Others argue that AI Overviews keep low-performing traffic away from your site. For many years, Google has already been answering queries with information cards. When you Google a business, you are likely to get a card with the business name, phone number, web address, and even a map with their location. Popular businesses might include reviews and specific details like daily open hours. These information cards have already been taking traffic away from your site. But was that the traffic that you wanted?
These folks argue, if the searcher just wanted to know an answer to a question they had while having a conversation with a friend, they would have come to your site for that information and then left. Their visit would have counted as a bounce and negatively affected your monthly traffic data. Same with the ones that just needed a phone number or wanted to know what time you close. They would have come to your website for that one thing and then left.
Google’s own research says that when people use AI Overviews to start understanding a topic, they end up searching more frequently and express higher satisfaction with the results. Their position is that these overviews scratch the surface and help visitors ask more in-depth follow-up questions. Other recent studies have found that click-through increased for companies featured in AI Overviews, while those without an AI Overview lost traffic.
One thing is for sure: AI Overviews’ prominent position at the top of the results have pushed down organic results and made it harder for high-ranking organic websites to get noticed.
Takeaway:
Mixed. Yes, it is possible that AI Overviews are preventing click-through. It is also possible this traffic was not going to convert. And depending on your product and position in the market, AI Overviews might drive slightly more traffic than organic search. Either way, the result is an even more competitive search landscape than before.
Should I optimize my content for AI Overviews?
The most obvious next question is “How can my brand rank for AI Overviews?” While this is an important question, remember that AI Overviews often include citations from multiple sources. So while your business may rank for an overview, it is likely not going to be alone.
The answer to this question is more of the same things you should already know. In order to rank highly, you should:
- Follow SEO best practices
- Be authentic (leverage first-hand experiences like anecdotes, reference data sources, and be as unique as possible with your perspective)
- Anticipate next steps (what does someone need to learn and in which order)
- Use structured data (schema, JSON, etc.)
- Include multimedia (images, video, gifs)
Lots of SEO companies want to help your business rank, and AI Overviews is the next frontier. But from all the articles we have reviewed (and there were many), the same best practices apply — there are no shortcuts to great content.
Takeaway
Yes, optimize your content for AI Overviews, but this does not mean you need to do more than what you are already doing. To be a highly quoted source within your industry has benefits for brand recognition and trust, but just like long-tail keywords, these searches may have low volume. In the end, it is an investment vs. return question. There is a significant overlap between the sources cited in AI Overviews and the top organic search results, therefore, if your site already ranks well, you can’t do much more to get into an AI Overview.
Should I continue investing in SEO for Google?
Some clients worry that Google will be unseated as the dominant search engine now that tools like OpenAI’s ChatGPT have seen an explosion of millions of users. While these tools are indeed experiencing hockey-stick growth, Google completely dominates search volume.
SparkToro charted a 20% growth in search queries for Google in 2024, and crunched the numbers to conclude Google receives 373 times more searches than ChatGPT.
To put that into context, Google handles 14 billion searches per day. The next closest competitor is Bing search with 613.5 million per day, followed by Yahoo, DuckDuckGo, and then Chat GPT. In other words, your investment would see a larger return if your team optimized content for Bing.com than for ChatGPT.
These numbers are fresh from March 2025. Things can change, of course, but AI tools are not used only for search, have a relatively small market share, and do not get used daily. They suffer from not being the default tool at hand, which for most people, is a web browser. Google remains synonymous with search for a large percent of the population.
Takeaway
Yes, continue to invest in SEO for Google specifically. Google is still the biggest player in the search market, and their share is gaining, not decreasing (yet).
If we don’t implement structured data, are we losing out on AI crawler traffic?
Structured data is great for all SEO, so actually, you should implement structured data like Schema.org for across-the-board SEO value.
For those of you using Google Tag Manager (GTM), you might know that you get some structured data for free. When a Googlebot crawls your site, it includes structured JSON data that it creates client-side, which means that Google gets the structured data but it is inaccessible to any other crawler. If the data existed server-side, other bots could access it.
Most non-Google robot crawlers do not execute Javascript, therefore, they miss out on anything rendered in the browser. These crawlers include Bing, Yahoo, ChatGPT, Claude, and Perplexity. So again, server-side structured data would benefit all the search engine crawlers that are not Google.
But do LLMs really need structured data?
Large Language Models (LLMs) use statistical analysis to predict what word will follow the previous set of words. They do not understand language as much as they can mathematically reproduce its patterns. Therefore, they create structure from unstructured data all the time.
But while LLMs process and understand unstructured text, providing structured data would significantly help interpret and categorize your content effectively and accurately.
Takeaway
The short answer is no, LLMs do not require structured data to create meaningful connections between content and search intent. But structured data would help them and any other search service to correctly label, tag, and organize your data. The longer answer is an investment in structured metadata would pay off in dividends for all search engines and crawlers.
How can we prepare for SEO’s evolving future?
In mid-2024, when Google first introduced AI Overviews, some in the SEO/SERP industry claimed sites could lose up to 25% of their traffic. That has not come to pass, with some sites reporting as high as 12% and others lows of 8.9% and 2.6% — not insignificant, but lower than expected. And the data is still coming in, with others reporting increases in traffic with specific kinds of intent.
While AI increasingly shapes search results, content strategy will need to shift for sites to remain visible and relevant. High-quality, authoritative, and authentic content that offers depth, accuracy, and unique insights is still valuable currency. AI algorithms are designed to identify and prioritize quality, trustworthy, and well-researched content for inclusion in their summaries.
Sites should continue to target long-tail and question-based keywords to align content with visitor’s increase in natural language queries. This type of content is often more challenging for AI to fully synthesize and may still necessitate user click-through for a comprehensive understanding. Going deeper to investigate specific intents behind longer conversational queries could also be crucial for attracting relevant traffic.
Finally, diversifying content formats by incorporating video, infographics, and interactive elements will continue to enhance engagement and provide unique value that text-based AI summaries don’t fully replicate. And optimizing content for featured snippets remains important, as appearing in these snippets increases the likelihood of a website’s content being cited within AI Overviews.
Takeaway
The fundamentals of great content and best-practice SEO has not changed as dramatically as the tools that crawl your site and serve your content have.
Final Thoughts
Anything in the tech space evolves rapidly, and SEO is no exception. While the methods and the tools we leverage might change, the fundamentals remain strong. Keep doing what you have been doing, keep being curious, and keep asking these important questions of those in your circle whom you trust. We’re all figuring these things out in real time and can benefit from each other’s expertise.
If you have in-depth questions about SEO, content management, and the evolving AI-powered landscape, reach out to our team and we’ll always do our best to answer them thoughtfully and from multiple angles.
AI disclaimer: Google’s Deep Research was used for initial exploration and source gathering. All sources cited in this article were reviewed by the author. ChatGPT was used for follow up questions, as well as AI Overviews for examples of common questions. This article synthesizes these sources and was written by a human.
Finding yourself bogged down with digital analytics? Spending hours just collecting and organizing information from your websites and apps? Looker Studio could be the answer to all your problems (well, maybe not all of them, but at least where data analytics are concerned).
This business intelligence tool from Google is designed to solve one of the biggest headaches out there for marketers: turning mountains of website data into actionable insights. Anyone who’s ever gone down the proverbial rabbit hole scouring Google Analytics for the right metrics or manually inputting numbers from a spreadsheet into their business intelligence platform knows that organizing this data is no small task. With Looker Studio, you can consolidate and simplify complicated data, freeing up more time for actual analysis.
With so many customizable features and templates, it does take time to set up a Looker Studio report that works for you. Since Google’s recent switch from Universal Analytics to Google Analytics 4, you might also find that certain Looker Studio reports aren’t working the way they used to.
Not to worry: Our Oomph engineers help clients configure and analyze data with Looker Studio every day, and we’ve learned a few tips along the way. Here’s what to know to make Looker Studio work for your business.
The benefits of using Looker Studio for data visualization and analysis
Formerly known as Google Data Studio, Looker Studio pulls, organizes, and visualizes data in one unified reporting experience. For marketers who rely heavily on data to make informed decisions, Looker Studio can save precious time and energy, which you can then invest in analyzing and interpreting data.
Key benefits of using Looker Studio include:
- Connecting data from multiple sources: The platform can unify data from a mind-boggling 800+ sources and 600+ data connectors, which means you can upload and integrate multiple data sets into one comprehensive report. This not only saves time, but also provides more accurate insights into business performance for organizations with complex digital environments.
- User-friendly insights: Looker Studio’s visual dashboards are easy to interpret, customize, and share – even with executives who might not be as digitally fluent as you. You can choose from a variety of drag-and-drop data visualization options, such as charts, graphs, and tables, or use Looker Studio’s pre-designed visualizations.
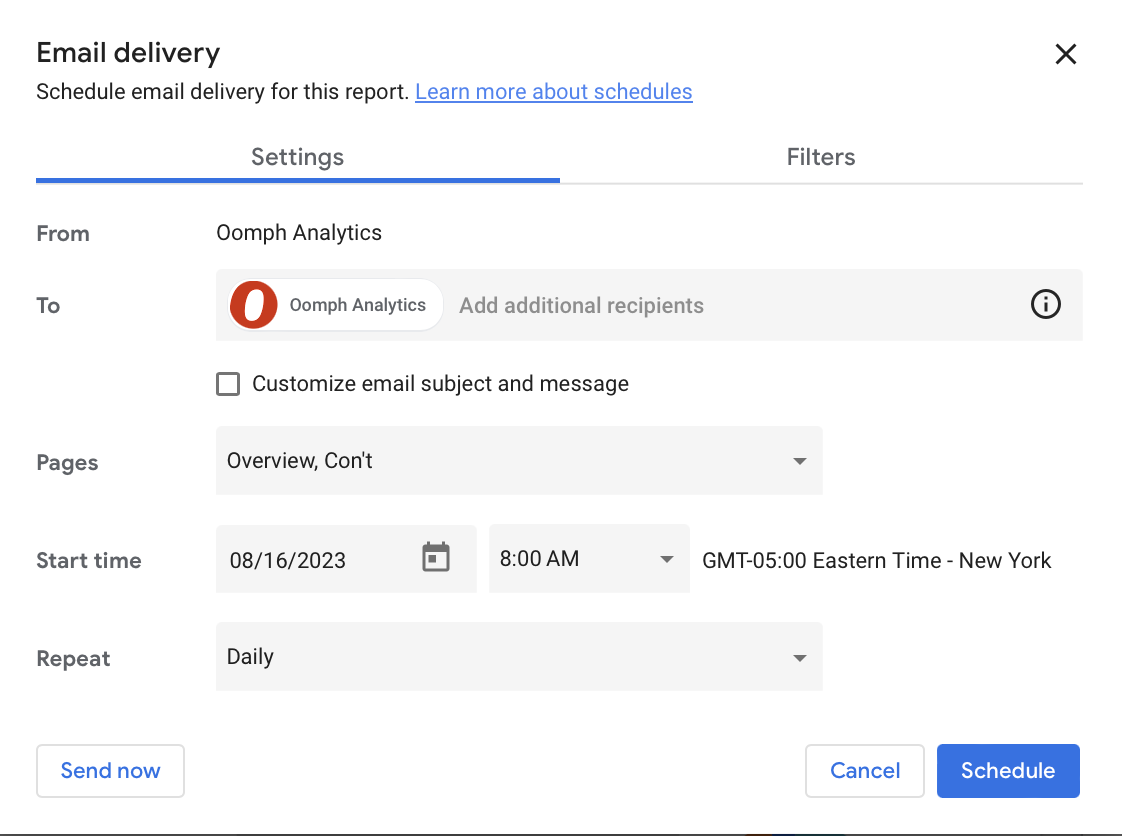
- Powerful customization: Want to be informed the minute your form conversion rate changes? With Looker Studio, you can set up alerts to notify you of significant changes in your data, enabling you to adjust your marketing strategy and optimize ROI in real time. You can also generate reports to track your progress and share them with your clients or team members.
How Oomph uses Looker Studio
As a digital-first company in the business of helping other digital-first companies, we’re big fans of Looker Studio. We think the platform is a great way to share trends on your websites and apps in an easy-to-digest way, making monthly or quarterly reporting much more efficient.
Whether you’re looking for basic insights or need sophisticated analysis, Looker Studio’s visualization capabilities can support smarter, more informed digital decision-making. Here’s a peek at some of the metrics we monitor for our own business, including:
- Number of users
- New users versus returning users
- Average time spent on site and on page
- Top pages viewed
- Traffic sources
- Traffic by device
- Event tracking and conversion rates
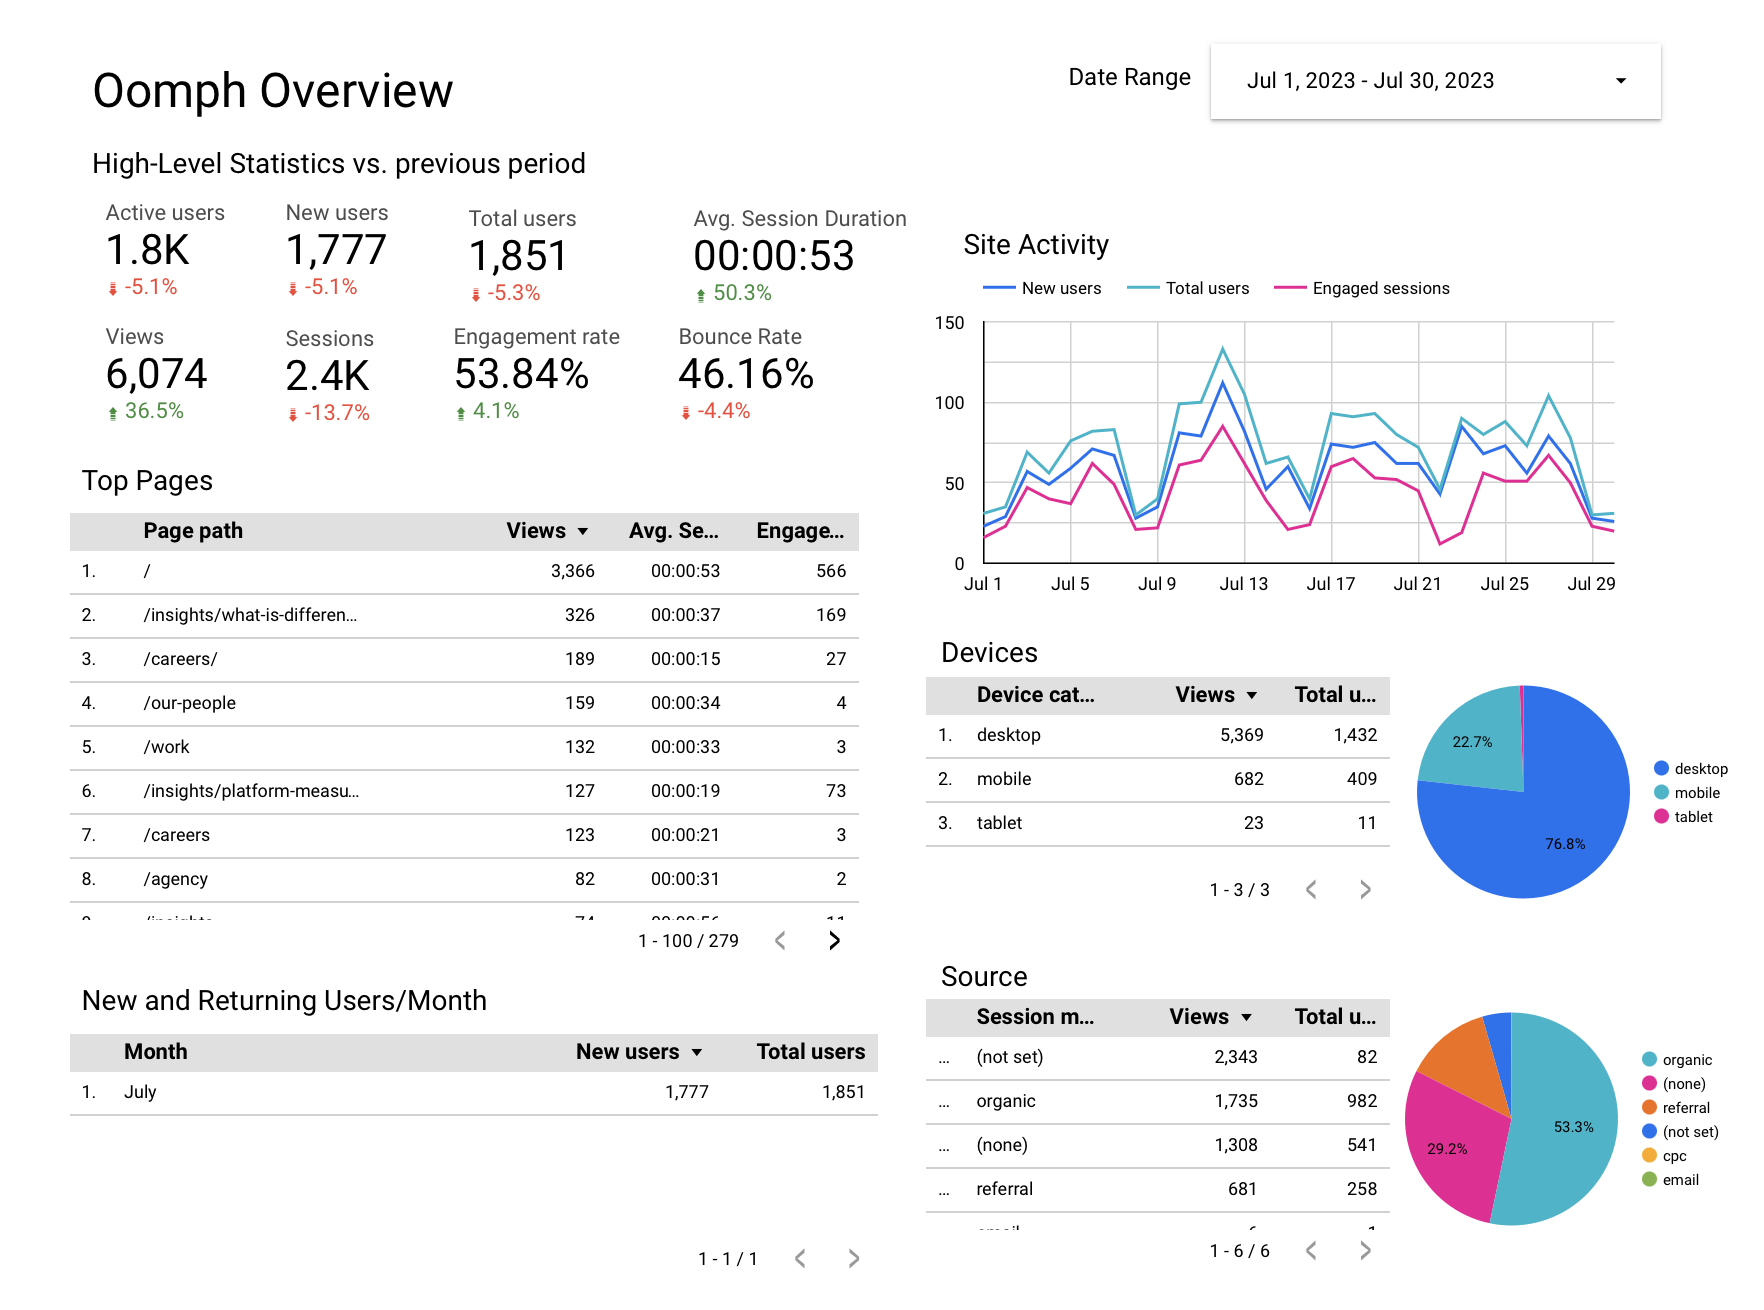
We also use the platform to drill deeper, comparing trends over time, identifying seasonal fluctuations and assessing the performance of specific campaigns. We leverage features like dashboards and filters in Looker Studio to give our clients an interactive view of their data.
How Looker Studio Works With GA4
Google Analytics, now known as GA4, is one of the primary tools we connect to Looker Studio. GA4 is the latest version of Google’s popular analytics platform and offers new features and functionality compared with its predecessor, Universal Analytics (UA), including new data visualization capabilities.
As many companies migrate over to GA4, they may be wondering if reporting will be similar between GA4 and Looker Studio – and if you need both.
While GA4 reports may challenge Looker Studio’s capabilities, Looker Studio provides a variety of features that go beyond what GA4 can do on its own. While GA4 dashboards and reports just include GA4 data, Looker Studio can import data from other sources as well. This means you can use Looker Studio to track trends in your site’s performance, regardless of the data source.
Looker Studio also has a unique feature called “LookML,” which allows users to create custom data models and transformations. This means you can tailor your data to your specific needs, rather than being limited by GA4’s built-in reporting. Finally, Looker Studio’s robust sharing and collaboration features allow teams to share data and insights easily and efficiently.
If your company set up Looker Studio before switching to GA4, you may notice a few metrics are now out of sync. Here are a few adjustments to get everything working correctly:
- Average time on page: This was previously a standard feature in UA that’s no longer available in GA4. To configure, you’ll need to track the “user engagement” metric divided by “number of sessions.”
- Bounce rate: Tracking bounce rate with GA4 now takes an additional step as well. To configure, subtract the “engagement rate” metric from 1 to arrive at your bounce rate.
- Events: Simply update your Looker Studio connection settings to use the new GA4 event schema and ensure that you’re using the correct event names and parameters in your LookML code.
How To Set Up a Looker Studio Report
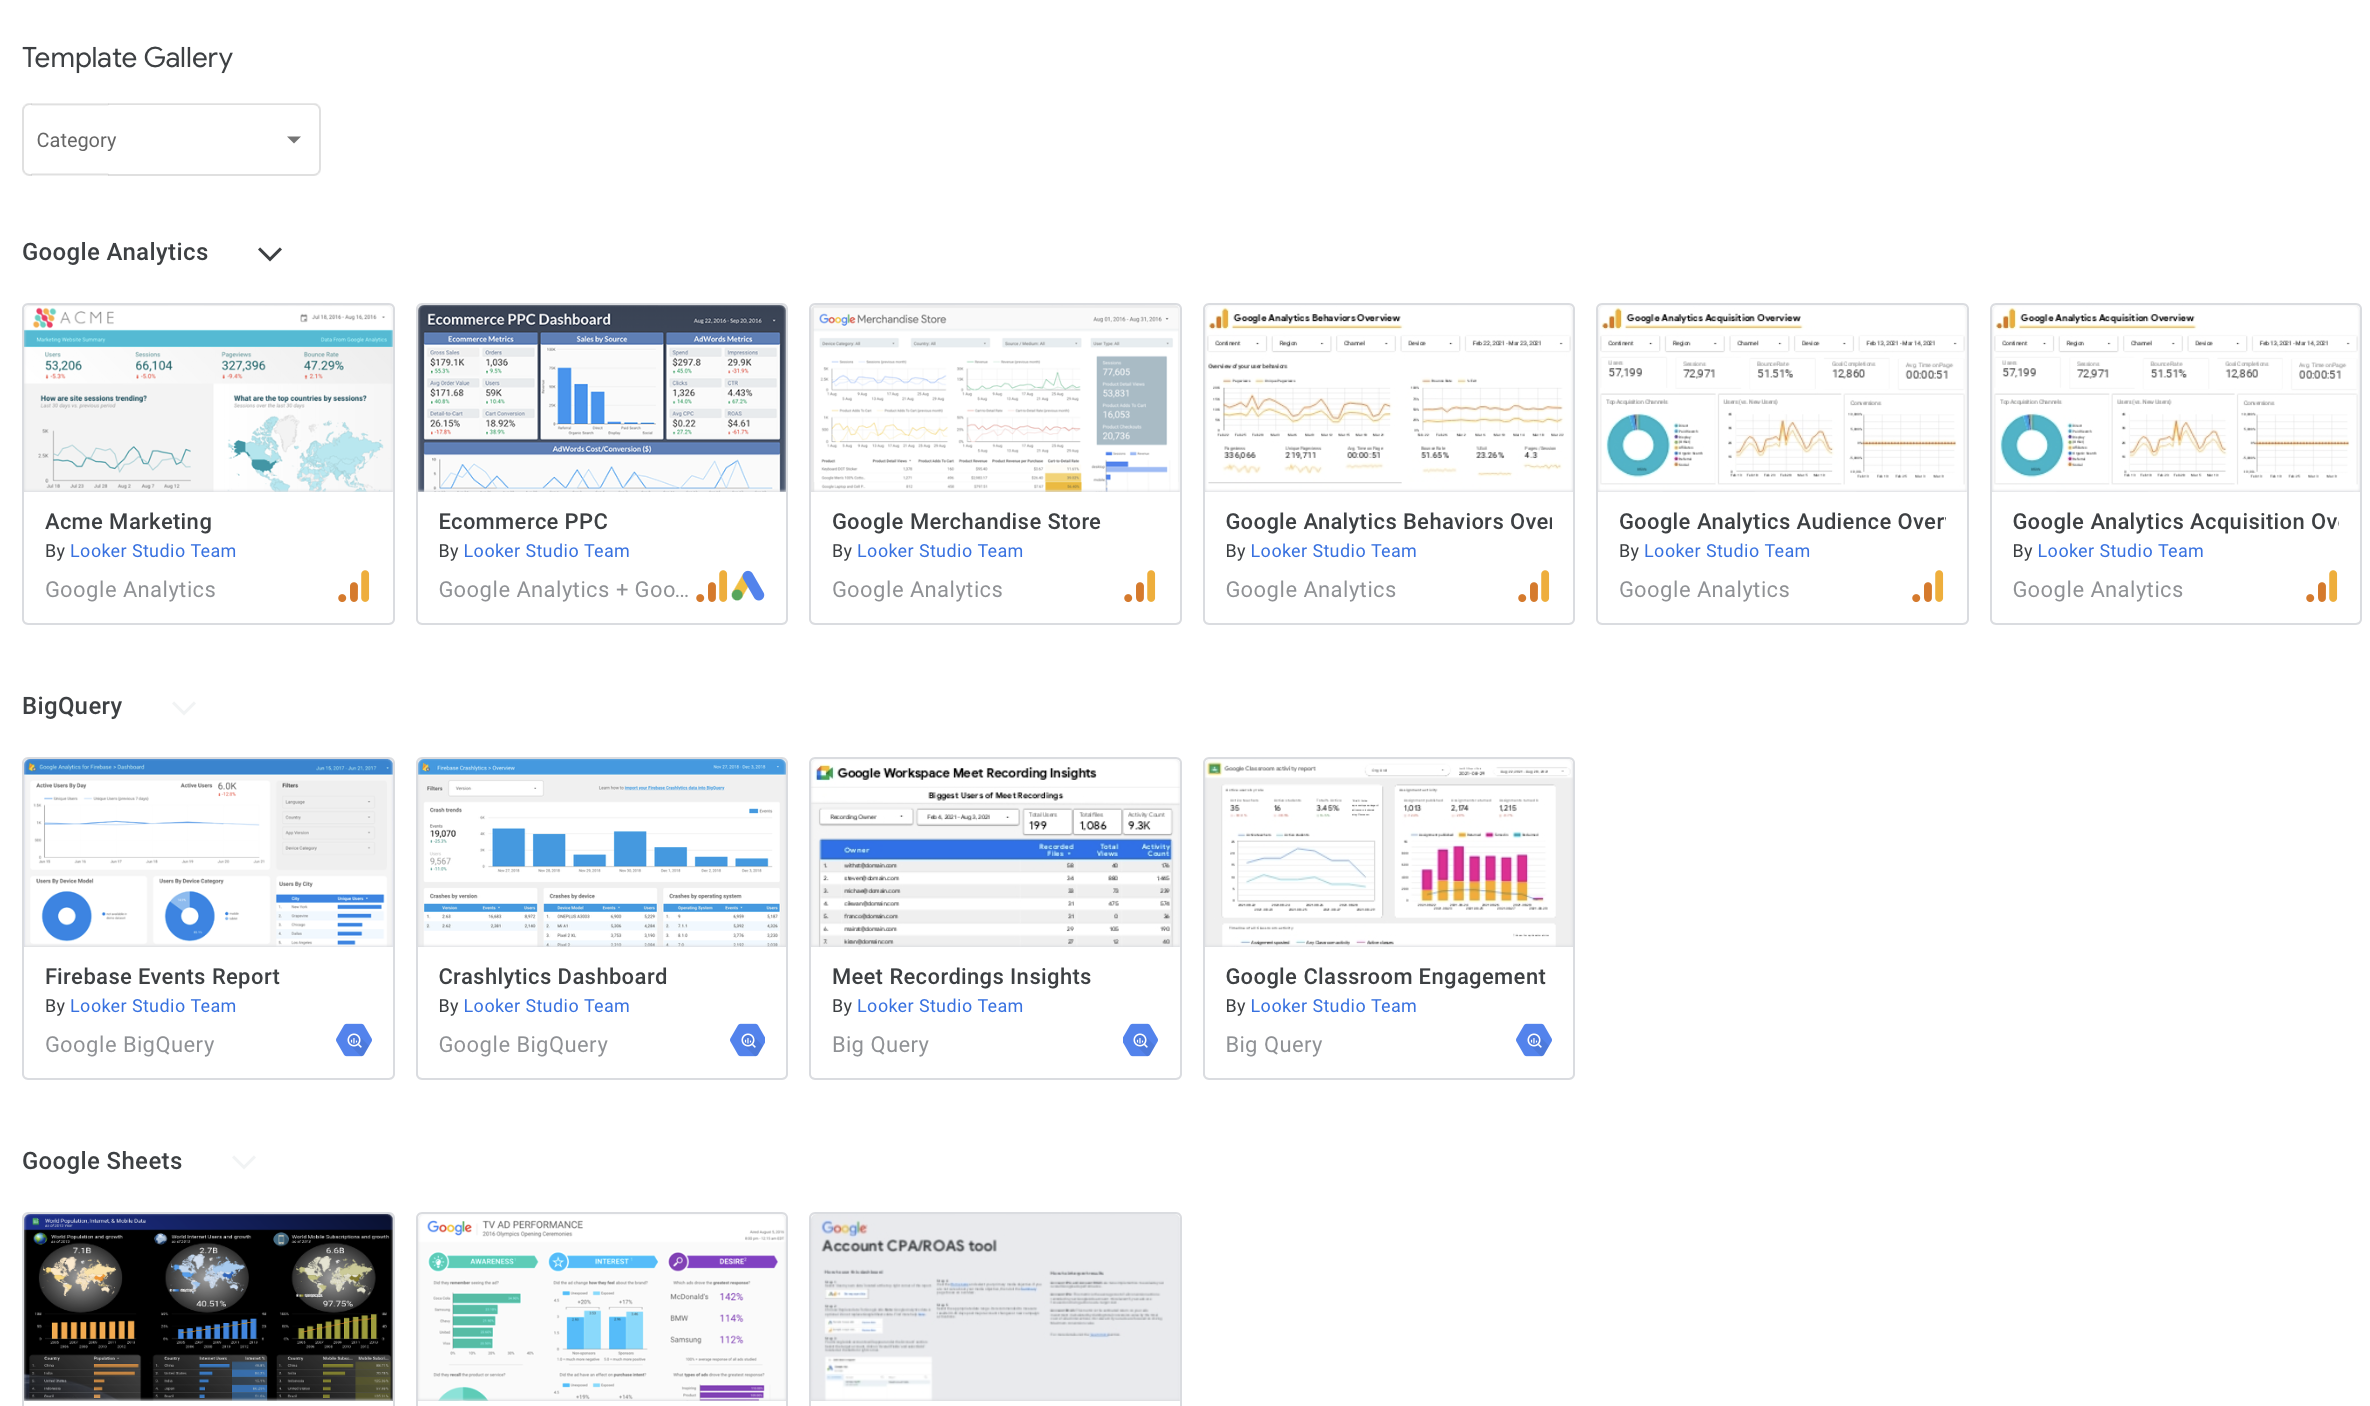
- Choose a template for your dashboard or create one from scratch. If you’re not sure, you can browse through templates to get an idea of what Looker can do.
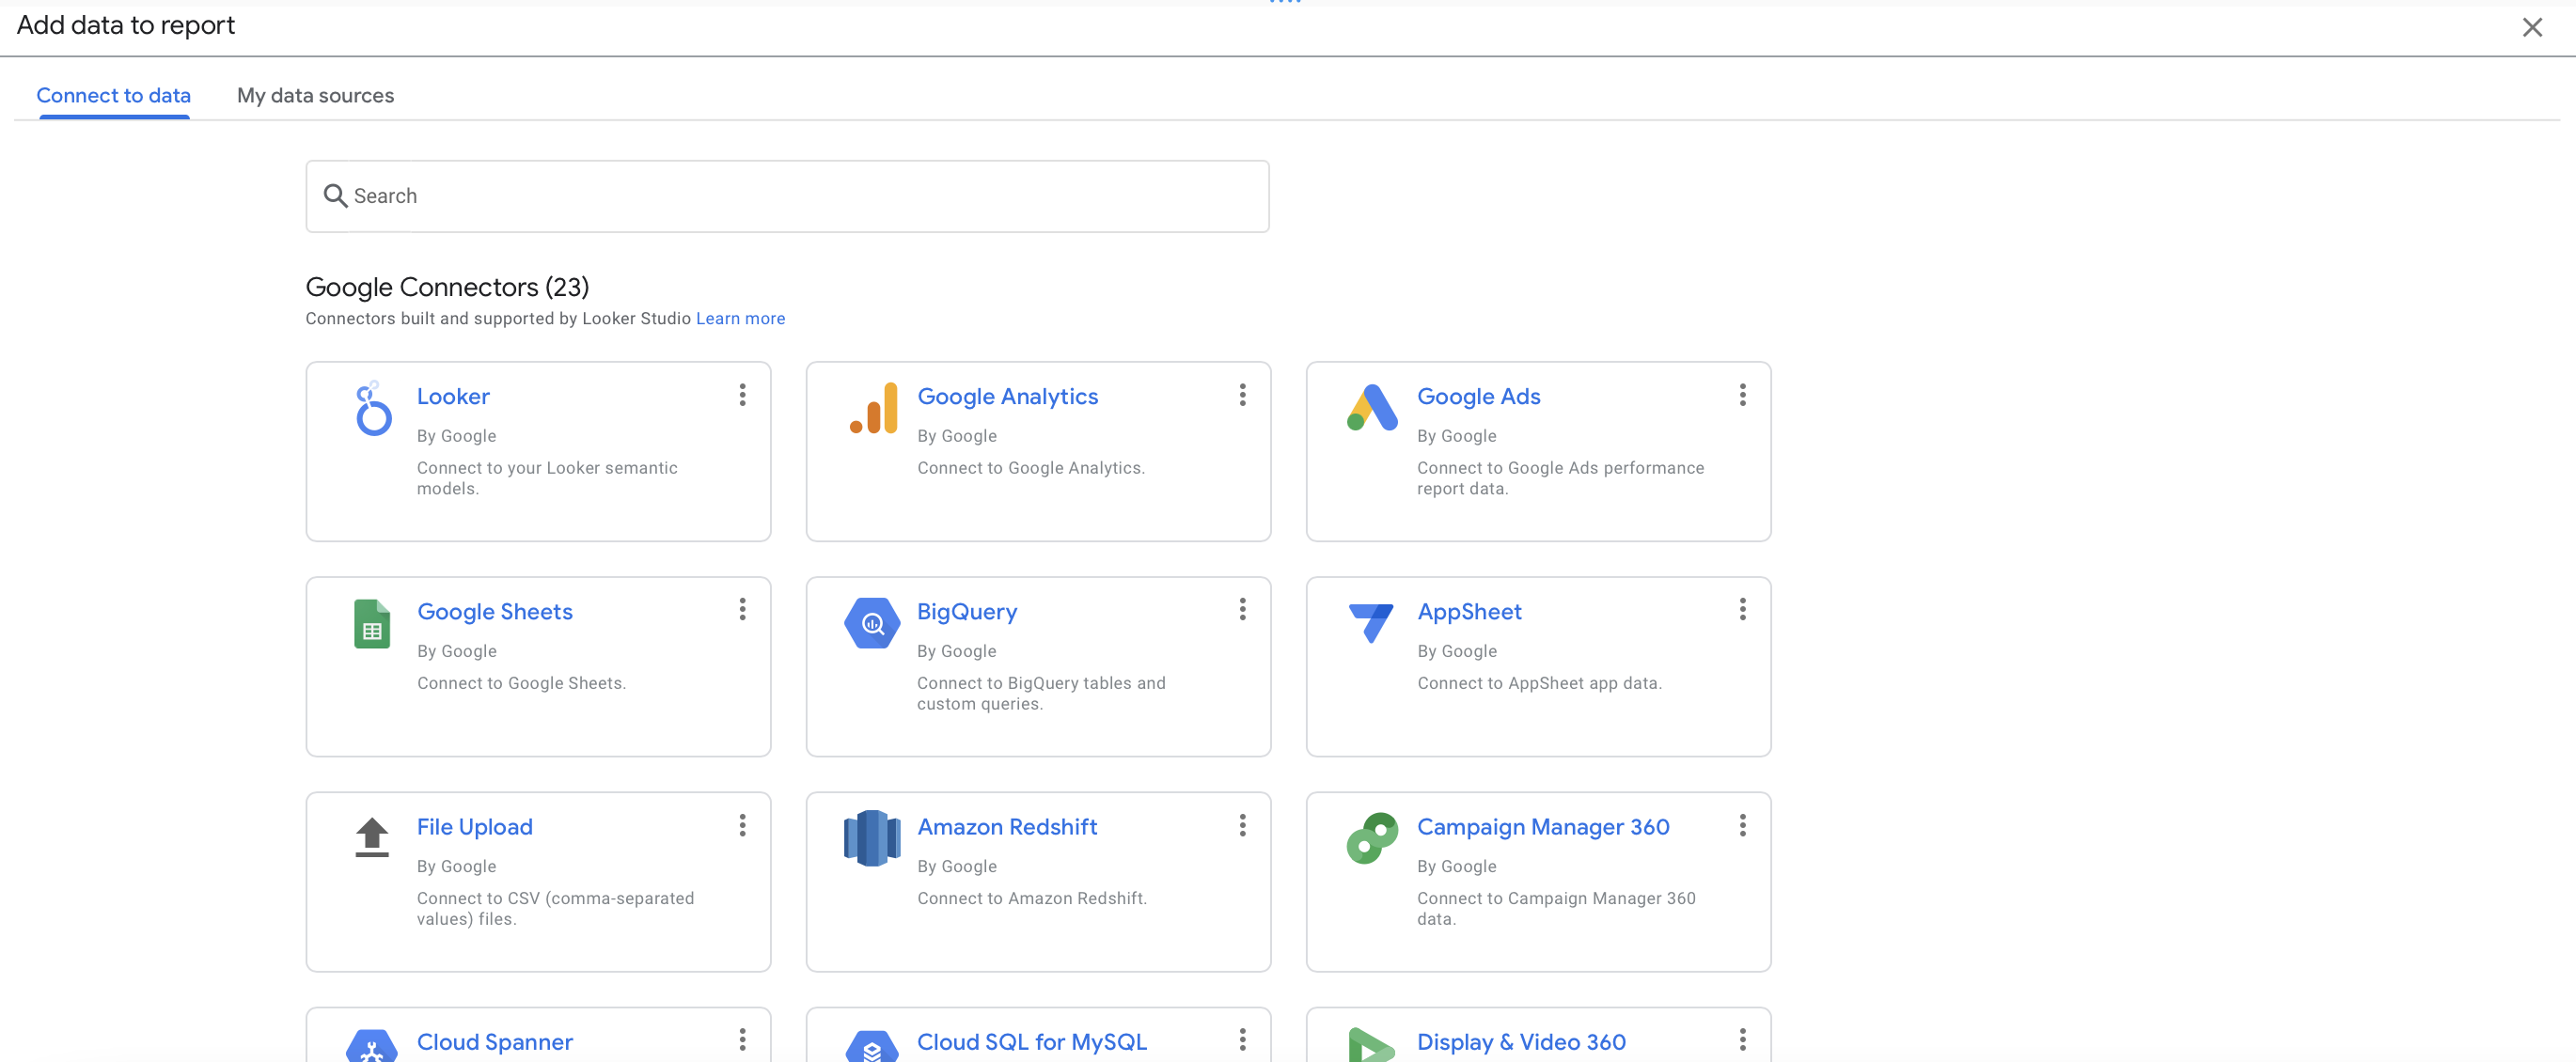
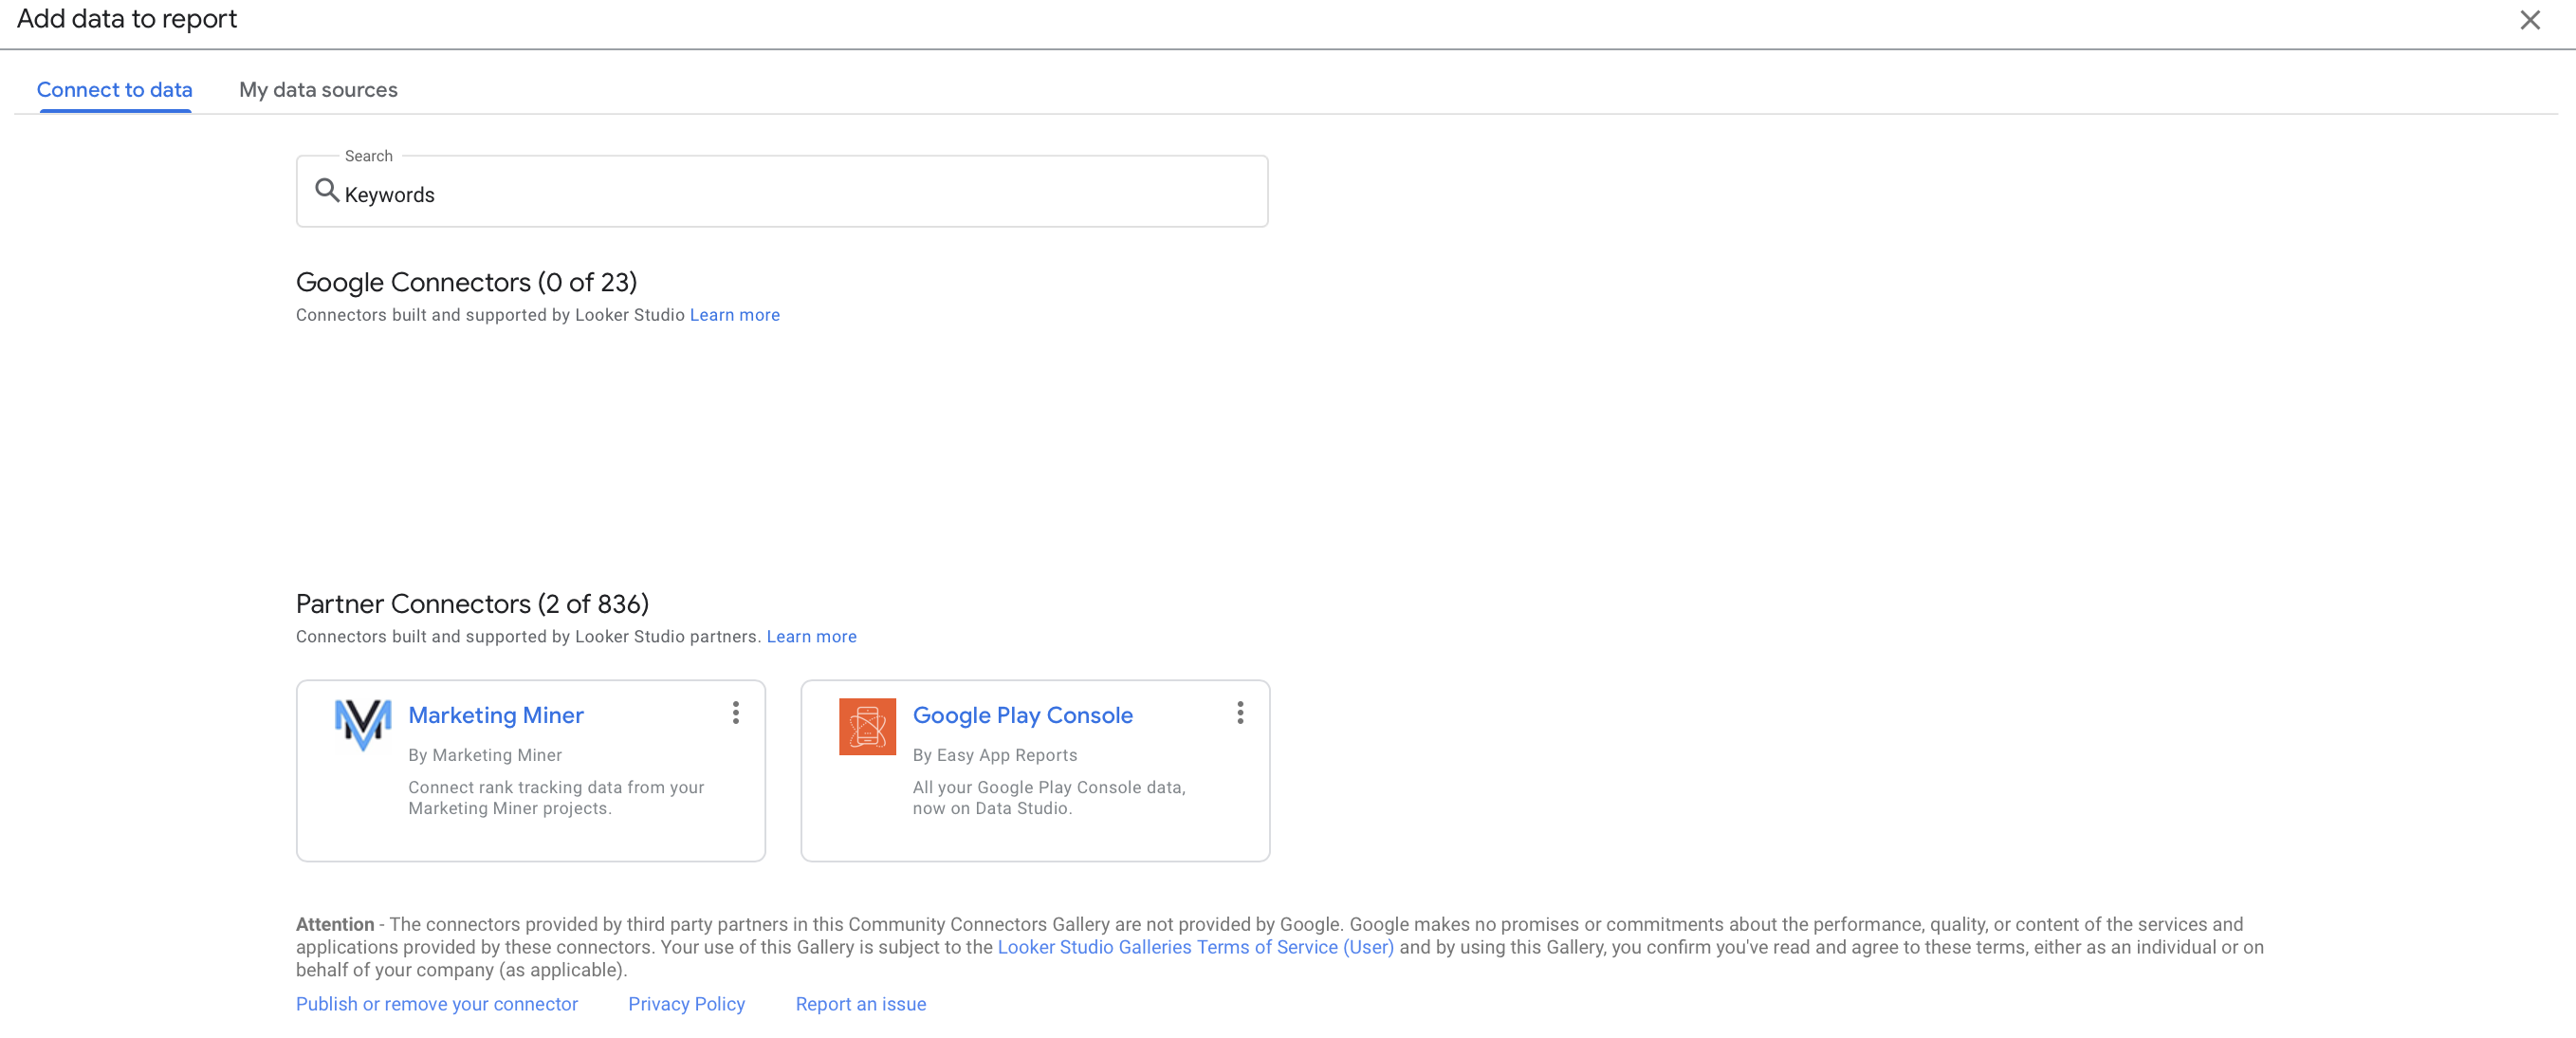
- Connect your data source. Looker supports a long list of sources, including Google, MySQL, AWS Redshift, and more. Don’t worry if your data isn’t in Google – Looker will likely be able to connect to it regardless.
- Choose your metrics. These are the specific data points you want to track and analyze in your report. You can customize your metrics to fit your specific needs.
- Build your dashboard. You can add charts, tables, and other visualizations to help you understand your data. Looker makes it easy to drag and drop these elements into place.
- Share it with others. You can either create a share link so that others can access the dashboard directly or you can set up automatic updates to be sent on a regular basis. This makes it easy for others to stay up-to-date on changes and progress.
A Powerful Path To Data Insights
The digital landscape is growing more fragmented and complex by the day, but tools like Looker Studio make it infinitely easier to find your path forward. Taking the time to configure and customize the platform can deliver major ROI by helping you understand user needs, pinpoint website strengths and challenges, and craft the right digital strategy.
Crunched for time or not sure where to start? Oomph can help take the hassle out of data analysis by setting up and monitoring your Looker Studio dashboards. Get in touch to chat about your needs.
Humans encounter thousands of words every day. As a website owner, that means your site content is vying for your user’s attention alongside emails from their colleagues, the novel on their nightstand, and even the permission slip scrunched at the bottom of their kid’s backpack.
How do you cut through the clutter to create site content that people actually want to read?
While you may already be choosing topics that are the most interesting and relevant for your audience, the structure of your writing may not be optimized for how people read. By understanding your audience’s reading behaviors following best practices for readability and accessibility, you can make sure your content works with people’s natural tendencies – not against them – to create a more engaging digital experience. An added bonus: Google shares many of those same tendencies, so content that’s designed well for humans is also more likely to perform well for organic SEO.
As a digital platform partner to many clients with content-rich sites, Oomph often works with brands to redesign their content for digital success. Here’s a look at the basic principles we apply to any site design – and how you can use them to your advantage.
How People Read Online
When we dive into a book, we typically settle in for a long haul, ready to soak up each chapter one by one. But when we open up a website, it’s more like scanning a newspaper or the entire bookshelf – we’re looking for something specific to catch our eye. We quickly scan, looking for anything that jumps out at us. If we see something interesting, then we’ll slow down and start reading in more detail.
Think of it like an animal following an information “scent,” identifying a mixture of clues that are likely to lead to the content you’re looking for. Most people will decide which pages to visit based on how likely the page will have the answer they’re looking for and how long it’s going to take to get the answer.
Users need to be hooked within a few moments of looking at a website or they’ll move on. They need to be able to identify and understand key factors like:
- The point of the information and why they should keep reading
- Whether they can trust the information and the source
- The type of content provided and any action expected from them, like signing up for an event
- How visually engaging and readable the content is
The takeaway for brands? Writing with your readers’ needs in mind is a way to show them you care and want to help them solve their problem. It’s also the key to achieving your site goals.
Your site content does more than just convey information – it’s about building trust, establishing rapport, and creating a connection that goes beyond the page. Whether you’re trying to sell a product or promote a cause, crafting content around your audience’s needs, desires, and preferences is the most effective way to compel them to take action. Here are four ways to set your website content up for success.
1. Put your data to work.
If you’re looking to refresh your current site, data can help you make informed choices about everything from your content strategy to your layout and design. Use digital reporting tools to answer questions like:
- Is our target audience visiting our site – and are other audiences visiting that we don’t know about yet?
- Which content do visitors download or engage with most frequently?
- What does a typical site visit look like? Are there places where users are getting stuck or bouncing off?
Google Analytics is a go-to tool for understanding the basics of who is visiting your site and how they’re engaging with your content. You can track metrics like session duration, traffic sources, and top-performing pages, all of which can help you better understand what your audience is looking for and what you want to tell them. (If you haven’t made the switch to Google Analytics’ latest platform, GA4, jump-start the process with our 12-step migration guide.)
Additional tools like Screaming Frog and Hotjar can give you even deeper insights, helping you track content structure and real-time user interactions.
2. Create a simple and consistent content structure.
When it comes to site content, consistency is like the foundation of a house (minus the power tools and hard hats).
A well-structured site not only helps users navigate and understand your content more easily, but also enhances the visual appeal and flow of the site. Think of it like a dance floor – you want your users to be able to move smoothly from one section to the next, without any awkward missteps.
That means focusing on shorter sentences, bullet points, and clear subheadings, all backed up by engaging visuals that serve as resting points for the eye. And while you’re at it, don’t forget to declutter your content — users don’t want to wade through a sea of unnecessary words just to find the nuggets of gold.
Ask yourself: Does this content flow smoothly, is it easy to scan, and does it make my key messages stand out? If the answer is yes, then you’re on your way to successful content.
3. Make sure visuals and content play nicely together.
When it comes to enhancing your content with visuals, the key is to strike a balance between style and substance. Your design should complement your content, not compete or distract from it.
Beyond their aesthetic appeal, well-designed visuals are important for creating a sense of credibility with users. Think back to the concept of information scent: If your design looks sloppy or inconsistent, users are less likely to trust the information you’re presenting. So make sure you’re using design elements wisely, creating ample white space, and avoiding anything that makes your content feel like a sales pitch.
4. Focus on accessibility.
When it comes to site content, accessibility can’t be ignored. Content should be engaging and informative and also conform to the , Website Content Accessibility Guidelines (WCAG). Tools like SortSite can help identify these issues and guide you toward accessibility success.
There are a number of things all sites need to consider:
- Using consistent text stylings, including text color, leading, kerning, and tracking.
- Design to support individuals with visual impairments, assistive technology like screen readers, and those that require navigation via the keyboard only
- Following heading orders and grouping content together to make it easier to scan. For example: Following a heading level 2 with a heading level 3 when the ideas are related, but starting with a new heading 2 if changing to a new section of thought.
- Using multiple methods to indicate action items and descriptive text for buttons and alternative text.
- PDFs can be useful, but are also big accessibility red flags, so it’s best to avoid using them when possible. If a PDF is a must, make sure it follows accessibility best practices.
Designing Engaging Content Doesn’t Need To Be a Full-Time Job
If you already have a library of content, auditing the content that already exists can be daunting. And sometimes, you need a little help from your friends. That’s where third-party experts (like us!) come in.
During our website discovery process, we use strategies like content and analytics audits, UX heuristics, and user journey mapping to help position client sites for success. We’ll help you identify areas for improvement, highlight opportunities for growth, and guide you toward achieving content greatness.
Ready for a fresh perspective on your content? We’d love to talk about it.
More than two years after Google announced the launch of its powerful new website analytics platform, Google Analytics 4 (GA4), the final countdown to make the switch is on.
GA4 will officially replace Google’s previous analytics platform, Universal Analytics (UA), on July 1, 2023. It’s the first major analytics update from Google since 2012 — and it’s a big deal. As we discussed in a blog post last year, GA4 uses big data and machine learning to provide a next-generation approach to measurement, including:
- Unifying data across multiple websites and apps
- A new focus on events vs. sessions
- Cookieless user tracking
- More personalized and predictive analytics
At Oomph, we’ve learned a thing or two about making the transition seamless while handling GA4 migrations for our clients – including a few platform “gotchas” that are definitely better to know in advance. Before you start your migration, do yourself a favor and explore our GA4 setup guide.
Your 12-Step GA4 Migration Checklist
Step 1: Create a GA4 Analytics Property and Implement Tagging
The Gist: Launch the GA4 setup assistant to create a new GA4 property for your site or app. For sites that already have UA installed, Google is beginning to create GA4 properties automatically for them beginning in March 2023 (unless you opt out). If you’re migrating from UA, you can connect your UA property to your GA4 property to use the existing Google tracking tag on your site. For new sites, you’ll need to add the tag directly to your site or via Google Tag Manager.
The Gotcha: During property setup, Google will ask you which data streams you’d like to add (websites, apps, etc…). This is simple if you’re just tracking one site, but gets more complex for organizations with multiple properties, like educational institutions or retailers with individual locations. While UA allowed you to separate data streams by geography or line of business, GA4 handles this differently. This Google guide can help you choose the ideal configuration for your business model.
Step 2: Update Your Data Retention Settings
The Gist: GA4 lets you control how long you retain data on users and events before it’s automatically deleted from Google’s servers. For user-level data, including conversions, you can hang on to data for up to 14 months. For other event data, you have the option to retain the information for 2 months or 14 months.
The Gotcha: The data retention limits are much shorter than UA, which allowed you to keep Google-signals data for up to 26 months in some cases. The default retention setting in GA4 is 2 months for some types of data – a surprisingly short window, in our opinion – so be sure to extend it to avoid data loss.
Step 3: Initialize BigQuery
The Gist: Have a lot of data to analyze? GA4 integrates with BigQuery, Google’s cloud-based data warehouse, so you can store historical data and run analyses on massive datasets. Google walks you through the steps here.
The Gotcha: Since GA4 has tight time limits on data retention as well as data limits on reporting , skipping this step could compromise your reporting. BigQuery is a helpful workaround for storing, analyzing and visualizing large amounts of complex data.
Step 4: Configure Enhanced Measurements
The Gist: GA4 measures much more than pageviews – you can now track actions like outbound link clicks, scrolls, and engagements with YouTube videos automatically through the platform. When you set up GA4, simply check the box for any metrics you want GA4 to monitor. You can still use Google tags to customize tracking for other types of events or use Google’s Measurement Protocol for advanced tracking.
The Gotcha: If you were previously measuring events through Google tags that GA4 will now measure automatically, take the time to review which ones to keep to avoid duplicating efforts. It may be simpler to use GA4 tracking – giving you a good reason to do that Google Tag Manager cleanup you’ve been meaning to get to.
Step 5: Configure Internal and Developer Traffic Settings
The Gist: To avoid having employees or IT teams cloud your insights, set up filters for internal and developer traffic. You can create up to 10 filters per property.
The Gotcha: Setting up filters for these users is only the first step – you’ll also need to toggle the filter to “Active” for it to take effect (a step that didn’t exist in UA). Make sure to turn yours on for accurate reporting.
Step 6: Migrate Users
The Gist: If you were previously using UA, you’ll need to migrate your users and their permission settings to GA4. Google has a step-by-step guide for migrating users.
The Gotcha: Migrating users is a little more complex than just clicking a button. You’ll need to install the GA4 Migrator from Google Analytics add-on, then decide how to migrate each user from UA. You also have the option to add users manually.
Step 7: Migrate Custom Events
The Gist: Event tracking has fundamentally changed in GA4. While UA offered three default parameters for events (eventcategory, action, and eventlabel), GA4 lets you create any custom conventions you’d like. With more options at your fingertips, it’s a great opportunity to think through your overall measurement approach and which data is truly useful for your business intelligence.
When mapping UA events to GA4, look first to see if GA4 is collecting the data as an enhanced measurement, automatically collected, or recommended event. If not, you can create your own custom event using custom definitions. Google has the details for mapping events.
The Gotcha: Don’t go overboard creating custom definitions – GA4 limits you to 50 per property.
Step 8: Migrate Custom Filters to Insights
The Gist: Custom filters in UA have become Insights in GA4. The platform offers two types of insights: automated insights based on unusual changes or emerging trends, and custom insights based on conditions that matter to you. As you implement GA4, you can set up custom insights for Google to display on your Insights dashboard. Google will also email alerts upon request.
The Gotcha: Similar to custom events, GA4 limits you to 50 custom insights per property.
Step 9: Migrate Your Segments
The Gist: Segments work differently in GA4 than they do in UA. In GA4, you’ll only find segments in Explorations. The good news is you can now set up segments for events, allowing you to segment data based on user behavior as well as more traditional segments like user geography or demographics.
The Gotcha: Each Exploration has a limit of 10 segments. If you’re using a lot of segments currently in UA, you’ll likely need to create individual reports to see data for each segment. While you can also create comparisons in reports for data subsets, those are even more limited at just four comparisons per report.
Step 10: Migrate Your Audiences
The Gist: Just like UA, GA4 allows you to set up audiences to explore trends among specific user groups. To migrate your audiences from one platform to another, you’ll need to manually create each audience in GA4.
The Gotcha: You can create a maximum of 100 audiences for each GA4 property (starting to sense a theme here?). Also, keep in mind that GA4 audiences don’t apply retroactively. While Google will provide information on users in the last 30 days who meet your audience criteria — for example, visitors from California who donated more than $100 — it won’t apply the audience filter to users earlier than that.
Step 11: Migrate Goals to Conversion Events
The Gist: If you were previously tracking goals in UA, you’ll need to migrate them over to GA4, where they’re now called conversion events. GA4 has a goals migration tool that makes this process pretty simple.
The Gotcha: GA4 limits you to 30 custom conversion events per property. If you’re in e-commerce or another industry with complex marketing needs, those 30 conversion events will add up very quickly. With GA4, it will be important to review conversion events regularly and retire ones that aren’t relevant anymore, like conversions for previous campaigns.
Step 12: Migrate Alerts
The Gist: Using custom alerts in UA? As we covered in Step 8, you can now set up custom insights to keep tabs on key changes in user activity. GA4 will deliver alerts through your Insights dashboard or email, based on your preferences.
The Gotcha: This one is actually more of a bonus – GA4 will now evaluate your data hourly, so you can learn about and respond to changes more quickly.
The Future of Measurement Is Here
GA4 is already transforming how brands think about measurement and user insights – and it’s only the beginning. While Google has been tight-lipped about the GA4 roadmap, we can likely expect even more enhancements and capabilities in the not-too-distant future. The sooner you make the transition to GA4, the sooner you’ll have access to a new level of intelligence to shape your digital roadmap and business decisions.
Need a hand getting started? We’re here to help – reach out to book a chat with us.
Was this blog written by ChatGPT? How would you really know? And what impact would it have on Oomph’s site if it were?
Yes, we know there are some great AI-detecting tools out there. But for the typical reader, picking an AI article out of a crowd can be challenging. And with AI tools like ChatGPT delivering better-quality results than ever, many companies are struggling to decide whether to hand their content and SEO reins over to the machines.
While AI can add value to your content, companies should proceed with caution to avoid some potentially big pitfalls. Here’s why.
Quality Content Is Critical to SEO
All the way back in 1996, Bill Gates said “Content is King.” This phrase became ubiquitous in the early years of SEO. At that time, you could rank well simply by writing about a search topic, then optimizing your writing with the right keywords.
Since then, search algorithms have evolved, and the Google search engine results page (SERP) is more crowded than ever (not to mention the new continuous scroll). While ranking isn’t as easy as it used to be, content — whether it’s a video, an image, a product, a blog, or a news story — still matters. When content ranks well, it’s an ad-spend-free magnet for readers that eventually become customers and subscribers. What else on your website can do that?
That makes your content special. It also puts a premium on producing a high volume of relevant content quickly. For years, brands have done this the old-fashioned way: with copywriters and designers researching, writing, revising, creating images, and publishing ad infinitum.
Until AI.
AI-Powered Content Generation Changes How We Make Content
There’s no point in denying it: AI will impact SEO. But it’s still up for debate just how deep that impact will be.
The rise of AI-powered language processing tools like ChatGPT and Meta’s Llama makes quick content generation a reality. They can easily produce high-quality content that will likely only get better with time. ChatGPT can produce an article in minutes, not hours, and even suggest keywords for you.
For all those reasons, marketers have embraced these new tools — ChatGPT shattered records when it reached 100 million daily active users in a mere two months. As the saying goes, though, just because we can, doesn’t mean we should — especially if using it means compromising on quality or losing what makes us, well, us.
After all, AI is a tool, not a human replacement. If you’re considering integrating AI into your martech stack, here’s what to keep in mind.
4 Things to Know Before Using AI for Content
1. Google may ding you.
In August 2022, Google released an algorithm update called the “helpful content update.” You can read more on Google’s blog, but what’s important is this: Google prioritizes content by people, for people.
In other words, using AI solely to churn out articles that feed the search engine beast won’t work. You should continue to create content that puts your audience first, is genuinely helpful, and is 100% unique to your brand.
But Google’s stance does beg the question: Will they really know if you used AI to generate your content? Well, they do have a very special set of skills…

While AI content can be good quality and easy to read, tools like Crossplag’s AI Content Detector and OpenAI’s GPT-2 Output Detector can detect whether something is written by a human or by an AI bot. That comes down, in part, to the fact that AI lacks EEAT – experience, expertise, authority, and trust – which is not just a major factor in SEO, but a major reason why people consume content in the first place.
2. AI isn’t always accurate.
AI culls information from across the web, and it’s remarkably good at it. But aggregating massive amounts of information isn’t the same as fact-checking. AI tools often get it wrong – even with easily verifiable, fact-based questions.
Take the question: What is the largest country in Central America that isn’t Mexico?
AI’s answer:
The largest country in Central America that isn’t Mexico is Guatemala. Guatemala has an area of about 108,890 square kilometers, making it the largest country in Central America by land area. It is bordered by Mexico to the north, Belize to the northeast, Honduras to the east, El Salvador to the southeast, and the Pacific Ocean to the south.
Google’s answer:
Nicaragua is the largest country in the subregion, with a total area of over 130 thousand square kilometers, followed by Honduras, with more than 112 thousand square kilometers.
(Hint: Google is right)
This is a problem for your business and for your SEO. Accuracy is an important part of EEAT. It’s especially critical for “your money or your life” (YMYL) content, like financial or medical advice. In these cases, the content you publish can and does impact real people’s lives and livelihoods.
Spotty accuracy has even prompted some sites, like StackOverflow, to ban AI-generated content.
3. You don’t have the rights to your AI-generated content.
AI-generated content isn’t actually copyrightable. Yes, you read that right.
As it stands, the courts have interpreted the Copyright Act to mean that only human-authored works can be copyrighted. Something is only legally defensible when it involves at least a minimal amount of creativity.
We’re all familiar with this concept when it comes to books, TV shows, movies, and paintings, but it matters for your website, too. You want your content and your ideas to be yours. If you use AI-generated content, be aware that it isn’t subject to standard intellectual property rules and may not be protected.
4. AI-generated content can’t capture your voice.
Even if you fly under Google’s radar with your AI content, it still won’t really feel like you. You are the only you. We know that sounds like it belongs on an inspirational poster, but it’s true. Your voice is what readers will connect with, believe in, and ultimately trust.
Sure, AI may succeed at stringing together facts and keywords to create content that ranks. And that content may even drive people to your site. But it lacks the emotional intelligence to infuse your content with real-life examples and anecdotes that make readers more likely to read, share, and engage with your content and your brand.
Your voice is also what sets you apart from other brands in your industry. Without that, why would a customer choose you?
AI and SEO Is a Journey, Not a Destination
AI is not the end of human-driven SEO. In reality, AI has only just arrived. But the real opportunity lies in finding out how AI can enhance, not replace, our work to create winning SEO content.
Think about content translation. Hand translation is the most premium translation option out there. It’s also costly. While machine translation on its own can be a bit of a mess, many translation companies actually start with an automated solution, then bring in the humans to polish that first translation into a final product. If you ask us, AI and SEO will work in much the same way.
Even in a post-AI world, SEO all comes down to this guidance from Google:
“If it is useful, helpful, original, and satisfies aspects of E-E-A-T, it might do well in Search. If it doesn’t, it might not.”
If and when you do decide to leverage AI, keep these tips in mind:
- Use AI to generate ideas, not create finished products. Asking ChatGPT to provide five industry trends that you turn into a series of articles is one thing; cutting and pasting a full AI-generated article onto your website is another.
- Fact-check anything and everything AI tells you. + Infuse your brand into every piece of AI-generated copy. Personal stories, insights, and anecdotes are what makes great content great.
At Oomph, we believe quality branded content is just one component of a digital experience that engages and inspires your audience.
Need help integrating SEO content into your company’s website? Let’s talk.
Google Analytics 4, or GA4, is Google’s fourth iteration of its website analytics platform. This is no ordinary upgrade! Leveraging the power of big data and machine learning, GA4 offers entirely new ways to collect and analyze user activity data across websites and apps.
While GA4 provides access to robust new tools and features for data-driven decision making, it also sheds many of the metrics and reports we’re used to in Google Analytics 3 (a.k.a. Universal Analytics, or UA).
Google will be sunsetting UA properties in July 2023. Here’s what you need to know about GA4’s capabilities — and why you should start the transition sooner rather than later.
Not sure which platform you currently have (UA vs. GA4)?
Take a look at this cheat sheet.
Key Benefits of Google Analytics 4
We’re living in a more privacy-centric world, and GA4 is Google’s answer to stricter data laws and browser regulations. GA4 is designed to function without third-party cookies, using machine learning and statistical modeling instead to collect data.
This change comes with a range of benefits, from more actionable user insights to enhanced reporting capabilities.
Broader Insights
Unlike UA, GA4 has the ability to track users across devices and platforms, combining all the data into a single property with a unified set of metrics and dimensions. This gives you a more complete picture of how users interact with your brand, whether they’re on your website, your mobile app, or both.
Another major advantage is that you can more effectively track conversions — particularly for users that might visit on their mobile, come back on desktop, and then download/purchase/register through your app. Because GA4 attributes actions to users across devices and platforms, you can see the entire journey a user takes from start to finish.
Predictive Metrics
Using machine learning, GA4 offers powerful new metrics to predict user actions and includes new data buckets like Acquisition, Engagement, Monetization, and Retention. These predictive metrics can help you better understand your audience and make more informed decisions, so you can do things like tailoring your website experience for different users or creating targeted marketing campaigns.
Customized Reporting
UA offers a set of standard reports with some customization options. By contrast, GA4 enables and encourages users to create custom reports with only the data they need.
With greater freedom to create reports, you can declutter your dashboard and make decisions more quickly by drilling down to the data that’s most important to you. You can even create a separate “Audiences” report with custom user definitions, further tailoring the data to support your business needs.
Key Features of Google Analytics 4
With comprehensive user tracking, predictive metrics, customizable reports, and more, GA4 promises to be much more powerful than any previous version of Google Analytics. Here are the core capabilities driving all of those benefits.
Event-Based Tracking
One of the biggest changes in GA4 is how user data is collected. In UA, data is collected via tags placed on each page of a website. Users are tracked via sessions, or set periods that begin and end when a user enters and exits a site.
Instead of relying on pageviews and sessions, GA4 tracks user interactions, known as “events,” as users complete them. This focus on individual user interactions provides a more complete picture of each user’s journey across your website or app.
This event-based model also makes it possible to track interactions that don’t happen on web pages but can be influenced by digital marketing, such as in-store visits or in-app purchases. And, it allows Google to more accurately deduplicate users.
Cross-Platform Data Consolidation
In UA, “properties” are where Analytics data is collected for individual websites and apps. You can then use views to see and report on the data in various ways.
GA4 uses individual data streams to combine data from different platforms into a single property. You can add multiple data streams into a property and create different views based on certain criteria.
For example, you could create a stream for all web traffic, a stream for all app traffic, or a stream for traffic from both that covers a given geographic area. By placing the same tracking code across different digital platforms, you can consolidate data to track users who move between the streams.
Advanced Analytics
Maybe the most exciting feature for data geeks like us, GA4’s Explorations Hub offers a suite of advanced data and analytical techniques that go well beyond standard reports. The Explore section lets you create custom analyses to uncover deeper insights about your website and app performance, with filters and segments so you can drill down even further.
GA4 also integrates with BigQuery, Google’s cloud-based data warehouse, where you can run complex analyses of very large datasets. Bonus: BigQuery offers near-unlimited data storage.
Machine Learning
In an increasingly cookie-less world, Google is attempting to balance privacy limitations with usable insights. Using machine learning, GA4 fills in data gaps and provides predictive insights about user behavior and trends.
Machine learning combines artificial intelligence (AI) and computer science to fill in gaps and make predictions. It essentially looks for patterns of activity that can be fed into an algorithm to understand and predict how users behave online.
As an example, GA4’s AI-powered insights can help identify user actions that are most likely to lead to conversions. Using metrics like purchase probability, churn probability, and revenue prediction, you can customize marketing campaigns or target specific audiences to achieve your conversion goals.
Why You Should Switch to GA4 ASAP
You’ll be able to collect and use platform data in your existing UA property until July 1, 2023. After that, you’ll be able to access historical data for only six months. That’s why we strongly recommend you implement GA4 as soon as possible.
Transitioning now will allow you to:
Feed The Machine
Many of GA4’s core features rely on machine learning, and in order for machine learning to be effective, the algorithm needs time to learn. The sooner you set up and start collecting data in GA4, the more time your models will have to analyze and learn, shaping the insights you’ll need down the road.
Train Your People
Those using GA4 will need time to learn the new terminology, user interface, and capabilities. Switching early gives your team time to get used to the new platform and work out new processes and reporting while you still have UA to fall back on.
Get Year-Over-Year Data
GA4 is forward-facing only, which means your new GA4 property will only collect data from the time of creation; it won’t import past data from UA. Once UA sunsets next year, you’ll be relying solely on GA4 for year-over-year data.
Why does that matter? Here at Oomph, when we launch client projects, we use Google Analytics data to analyze digital platform performance so we can develop the best possible user experience. By examining user flows, page visits, common search terms, engagement metrics, and more, we can very quickly get a picture of where a platform has strengths and weak points. And we need your historical data to do it.
Ready to switch to Google Analytics 4? It’s a relatively simple process. Just follow the steps Google provides, whether you want to switch from UA to GA4 or set up a GA4 property alongside an existing UA property.
If you’re not feeling confident about handling the transition alone, we’d love to help. Get in touch with us today.
If you can’t measure it, you can’t improve it. It’s true for your business, and it’s true for your digital platform. Yet we’ve seen organizations from startups to enterprises neglect to incorporate measurement into their platform strategy.
Data shows you what is and isn’t working in your platform. And, unlike most websites, platforms provide detailed information about known users across specific touchpoints — accurate, first-party data that doesn’t rely on cookies or fuzzy analytics. Actionable insights await; you just have to know what you’re measuring for.
Here’s how to take a strategic approach to measuring platform performance.
Start From the Top
Measuring the success of your platform involves the same general principles used in strategic planning. Start from the top and work your way down:
- What are your organization’s overall goals?
- What are the business objectives that drive those goals?
- What does your platform need to accomplish, in order to support those objectives?
- What is the core purpose your platform must meet to achieve its goals?
Once you define your platform’s core purpose, you can identify which metrics to track. Just make sure that if you move the needle on those metrics, you’re truly moving the needle for your business.
Here’s an example: Let’s say you run a healthcare system whose primary goal is to save lives. To meet that goal, your employees need speedy access to your procedures for patient care. So, you build an intranet platform in order to provide the fastest possible access to that critical information. Your core purpose is to make sure this information is as easy to find as possible, so employees have critical information at critical moments.
What Should You Measure?
You’ve identified your platform’s core purpose. Next question is, what is the core interaction your platform relies on to achieve that purpose? What’s the single most important thing you need users to do? That action determines how you define an “active” platform user, and it’s the key driver for what you should measure.
Just like with social media, where the term “monthly active users” is widely used but has many different meanings, business platforms often have unique definitions of an active user. A company intranet focused on employee engagement might define an active user as someone who posts content a certain number of times per month. A business platform offering exclusive deals to attract new customers might define an active user as a customer who redeems at least one deal per year.
Whatever your platform’s purpose is, you need to be tracking metrics related to your definition of an active user, in order to optimize the core interaction that drives your business goals.
Examples of Useful Metrics
Before we dive into the list, there’s a caveat: Just because you can measure a ton of metrics doesn’t mean you should. Too much data can be distracting, and paying attention to too many metrics can create confusion and cause analysis paralysis. The goal of measurement isn’t to manage a dashboard; it’s to make decisions and take actions that drive positive business outcomes.
Choose a primary goal, define a core objective and active user, and aim for up to five core metrics to measure success. Here are some examples:
Growth
If your business goals depend on having a large number of platform users, you might use one of the following growth measures:
- Total number of users over time
- Rate at which new people join the platform
- Rate of user attrition in a given period
Reach
This is useful for platforms where you’re looking to engage a certain proportion of a population, such as your employees or your customer base. You might track:
- Total number of registered users
- Percentage of total registered users that are active
- Total logins versus unique logins
Engagement
Engagement covers a lot of ground, and it’s easy to get lost in the weeds. Focus on the metrics that tell you how people are responding to your efforts to engage them at various touchpoints. Here are some examples:
- Number of posts per user / Average number of responses per post
- Number of unique users completing an action, like submitting a form
- Number of support requests (are users confused?)
Begin at the Beginning
It’s a mistake to think about measurement only after you’ve built your platform. Remember, platform measurement isn’t as easy as dropping in base Google Analytics code. Platform metrics are deep and nuanced, so you need to think strategically from the start. Plan the key metrics up front, and incorporate measurement into your platform roadmap from the beginning.
Your game plan, in a nutshell:
- Decide what to measure
- Implement tracking capabilities
- Measure platform performance
- Analyze the results and find actionable insights
- Make decisions: what’s working, and what needs to change?
Establishing measurement practices early on enables you to continually track, analyze, and optimize performance over the life of your platform. Already launched? Fear not. It’s never too late to implement measurement techniques to optimize platform performance.
If you’re thinking about how to be more strategic with platform measurement, we’d love to help. Feel free to reach out with any questions you have.